 流行的APM(Application Performance Management工具有很多,比如Cat、Zipkin、Pinpoint、SkyWalking,优秀的监控工具还有很多,其它比如还有zabbix、prometheus、Arthas、Grafana之类的。这里主要介绍SkyWalking,它是一款优秀的国产APM工具,包括了分布式追踪、性能指标分析、应用和服务依赖分析等。Skywalking是一个分布式系统的应用程序性能监视工具,专为微服务、云原生架构和基于容器(Docker、K8s、Mesos)架构而设计。SkyWalking 是观察性分析平台和应用性能管理系统。提供分布式追踪、服务网格遥测分析、度量聚合和可视化一体化解决方案。
 流行的APM(Application Performance Management工具有很多,比如Cat、Zipkin、Pinpoint、SkyWalking。优秀的监控工具还有很多,其它比如还有zabbix、prometheus、Arthas、Grafana之类的。这里主要介绍SkyWalking,它是一款优秀的国产APM工具,包括了分布式追踪、性能指标分析、应用和服务依赖分析等。
Skywalking是一个分布式系统的应用程序性能监视工具,专为微服务、云原生架构和基于容器(Docker、K8s、Mesos)架构而设计。SkyWalking 是观察性分析平台和应用性能管理系统。提供分布式追踪、服务网格遥测分析、度量聚合和可视化一体化解决方案。支持Java, .Net Core, PHP, NodeJS, Golang, LUA语言探针,支持Envoy + Istio构建的Service Mesh。
v介绍
1.1 SkyWalking 在逻辑上分为四部分:探针、平台后端、存储和用户界面。其架构图如下:

图片来源于网络,侵删。
探针:基于不同的来源探针可能是不一样的,但作用都是收集数据,将数据格式化为SkyWalking适用的格式。例如在Java中则是做字节码植入,无侵入式的收集,并通过HTTP或者GRPC方式发送数据到平台后端.
平台后端:是一个支持集群模式运行的后台,用于数据聚合、数据分析以及驱动数据流从探针到用户界面的流程。平台后端还提供了各种可插拔的能力,如不同来源数据(如来自 Zipkin)格式化,不同存储系统以及集群管理。你甚至还可以使用观测分析语言来进行自定义聚合分析。
存储:是开放式的,可以选择一个既有的存储系统,如ElasticSearch、H2 或 MySQL 集群(Sharding-Sphere 管理),也可以选择自己实现一个存储系统。
用户界面:SkyWalking的可视化界面,UI非常炫酷且强大,同样它也是可定制以匹配你已存在的后端的。
1.2 在SkyWalking中也存在服务、服务实例及端点概念,因为SkyWalking就是提供了这些概念的观测能力:
服务(Service):表示对请求提供相同行为的一系列或一组工作负载。在使用打点代理或 SDK 的时候,你可以定义服务的名字。如果不定义的话,SkyWalking 将会使用你在平台上定义的名字,如 Istio。
服务实例(Service Instance):上述的一组工作负载中的每一个工作负载称为一个实例。就像 Kubernetes 中的 pods 一样,服务实例未必就是操作系统上的一个进程。但当你在使用打点代理的时候, 一个服务实例实际就是操作系统上的一个真实进程。
端点(Endpoint):对于特定服务所接收的请求路径,如 HTTP 的 URI 路径和 gRPC 服务的类名 + 方法签名
1.3 SkyWalking的优势如下:
1.多种监控手段,语言探针和服务网格(Service Mesh)
2.模块化,UI、存储、集群管理多种机制可选
3.支持告警(告警可以推送到钉钉)
4.优秀的可视化方案
v环境准备
2.1 拉取镜像
docker pull elasticsearch:7.5.1docker pull apache/skywalking-oap-server:8.3.0-es7docker pull apache/skywalking-ui:8.3.0
2.2 创建&启动elasticsearch
docker run -d --name=es7 \-p 9200:9200 -p 9300:9300 \-e "discovery.type=single-node" elasticsearch:7.5.1
注意:若创建es持久化目录,则按下面的命令执行。
mkdir -p /data/elasticsearchdocker cp es7:/usr/share/elasticsearch/data /data/elasticsearch/docker cp es7:/usr/share/elasticsearch/logs /data/elasticsearch/docker rm -f es7docker run -d --name=es7 \ --restart=always \ -p 9200:9200 -p 9300:9300 \ -e "discovery.type=single-node" \ -v /data/elasticsearch/data:/usr/share/elasticsearch/data \ -v /data/elasticsearch/logs:/usr/share/elasticsearch/logs \elasticsearch:7.5.1
2.3 创建&启动OAP
docker run --name oap --restart always -d \--restart=always \-e TZ=Asia/Shanghai \-p 12800:12800 \-p 11800:11800 \--link es7:es7 \-e SW_STORAGE=elasticsearch7 \-e SW_STORAGE_ES_CLUSTER_NODES=es7:9200 \apache/skywalking-oap-server:8.3.0-es7
SW_STORAGE:表示选择elasticsearch7作为存储组件
SW_STORAGE_ES_CLUSTER_NODES:elasticsearch的节点,多个用逗号隔开
以上参数均为application.yml文件中的参数。
application.yml详细信息如下:


# Licensed to the Apache Software Foundation (ASF) under one or more# contributor license agreements. See the NOTICE file distributed with# this work for additional information regarding copyright ownership.# The ASF licenses this file to You under the Apache License, Version 2.0# (the "License"); you may not use this file except in compliance with# the License. You may obtain a copy of the License at## Unless required by applicable law or agreed to in writing, software# distributed under the License is distributed on an "AS IS" BASIS,# WITHOUT WARRANTIES OR CONDITIONS OF ANY KIND, either express or implied.# See the License for the specific language governing permissions and# limitations under the License.cluster: selector: ${SW_CLUSTER:standalone} standalone: # Please check your ZooKeeper is 3.5+, However, it is also compatible with ZooKeeper 3.4.x. Replace the ZooKeeper 3.5+ # library the oap-libs folder with your ZooKeeper 3.4.x library. zookeeper: nameSpace: ${SW_NAMESPACE:""} hostPort: ${SW_CLUSTER_ZK_HOST_PORT:localhost:2181} # Retry Policy baseSleepTimeMs: ${SW_CLUSTER_ZK_SLEEP_TIME:1000} # initial amount of time to wait between retries maxRetries: ${SW_CLUSTER_ZK_MAX_RETRIES:3} # max number of times to retry # Enable ACL enableACL: ${SW_ZK_ENABLE_ACL:false} # disable ACL in default schema: ${SW_ZK_SCHEMA:digest} # only support digest schema expression: ${SW_ZK_EXPRESSION:skywalking:skywalking} kubernetes: namespace: ${SW_CLUSTER_K8S_NAMESPACE:default} labelSelector: ${SW_CLUSTER_K8S_LABEL:app=collector,release=skywalking} uidEnvName: ${SW_CLUSTER_K8S_UID:SKYWALKING_COLLECTOR_UID} consul: serviceName: ${SW_SERVICE_NAME:"SkyWalking_OAP_Cluster"} # Consul cluster nodes, example: 10.0.0.1:8500,10.0.0.2:8500,10.0.0.3:8500 hostPort: ${SW_CLUSTER_CONSUL_HOST_PORT:localhost:8500} aclToken: ${SW_CLUSTER_CONSUL_ACLTOKEN:""} etcd: serviceName: ${SW_SERVICE_NAME:"SkyWalking_OAP_Cluster"} # etcd cluster nodes, example: 10.0.0.1:2379,10.0.0.2:2379,10.0.0.3:2379 hostPort: ${SW_CLUSTER_ETCD_HOST_PORT:localhost:2379} nacos: serviceName: ${SW_SERVICE_NAME:"SkyWalking_OAP_Cluster"} hostPort: ${SW_CLUSTER_NACOS_HOST_PORT:localhost:8848} # Nacos Configuration namespace namespace: ${SW_CLUSTER_NACOS_NAMESPACE:"public"} # Nacos auth username username: ${SW_CLUSTER_NACOS_USERNAME:""} password: ${SW_CLUSTER_NACOS_PASSWORD:""} # Nacos auth accessKey accessKey: ${SW_CLUSTER_NACOS_ACCESSKEY:""} secretKey: ${SW_CLUSTER_NACOS_SECRETKEY:""}core: selector: ${SW_CORE:default} default: # Mixed: Receive agent data, Level 1 aggregate, Level 2 aggregate # Receiver: Receive agent data, Level 1 aggregate # Aggregator: Level 2 aggregate role: ${SW_CORE_ROLE:Mixed} # Mixed/Receiver/Aggregator restHost: ${SW_CORE_REST_HOST:0.0.0.0} restPort: ${SW_CORE_REST_PORT:12800} restContextPath: ${SW_CORE_REST_CONTEXT_PATH:/} restMinThreads: ${SW_CORE_REST_JETTY_MIN_THREADS:1} restMaxThreads: ${SW_CORE_REST_JETTY_MAX_THREADS:200} restIdleTimeOut: ${SW_CORE_REST_JETTY_IDLE_TIMEOUT:30000} restAcceptorPriorityDelta: ${SW_CORE_REST_JETTY_DELTA:0} restAcceptQueueSize: ${SW_CORE_REST_JETTY_QUEUE_SIZE:0} gRPCHost: ${SW_CORE_GRPC_HOST:0.0.0.0} gRPCPort: ${SW_CORE_GRPC_PORT:11800} maxConcurrentCallsPerConnection: ${SW_CORE_GRPC_MAX_CONCURRENT_CALL:0} maxMessageSize: ${SW_CORE_GRPC_MAX_MESSAGE_SIZE:0} gRPCThreadPoolQueueSize: ${SW_CORE_GRPC_POOL_QUEUE_SIZE:-1} gRPCThreadPoolSize: ${SW_CORE_GRPC_THREAD_POOL_SIZE:-1} gRPCSslEnabled: ${SW_CORE_GRPC_SSL_ENABLED:false} gRPCSslKeyPath: ${SW_CORE_GRPC_SSL_KEY_PATH:""} gRPCSslCertChainPath: ${SW_CORE_GRPC_SSL_CERT_CHAIN_PATH:""} gRPCSslTrustedCAPath: ${SW_CORE_GRPC_SSL_TRUSTED_CA_PATH:""} downsampling: - Hour - Day # Set a timeout on metrics data. After the timeout has expired, the metrics data will automatically be deleted. enableDataKeeperExecutor: ${SW_CORE_ENABLE_DATA_KEEPER_EXECUTOR:true} # Turn it off then automatically metrics data delete will be close. dataKeeperExecutePeriod: ${SW_CORE_DATA_KEEPER_EXECUTE_PERIOD:5} # How often the data keeper executor runs periodically, unit is minute recordDataTTL: ${SW_CORE_RECORD_DATA_TTL:3} # Unit is day metricsDataTTL: ${SW_CORE_METRICS_DATA_TTL:7} # Unit is day # Cache metrics data for 1 minute to reduce database queries, and if the OAP cluster changes within that minute, # the metrics may not be accurate within that minute. enableDatabaseSession: ${SW_CORE_ENABLE_DATABASE_SESSION:true} topNReportPeriod: ${SW_CORE_TOPN_REPORT_PERIOD:10} # top_n record worker report cycle, unit is minute # Extra model column are the column defined by in the codes, These columns of model are not required logically in aggregation or further query, # and it will cause more load for memory, network of OAP and storage. # But, being activated, user could see the name in the storage entities, which make users easier to use 3rd party tool, such as Kibana->ES, to query the data by themselves. activeExtraModelColumns: ${SW_CORE_ACTIVE_EXTRA_MODEL_COLUMNS:false} # The max length of service + instance names should be less than 200 serviceNameMaxLength: ${SW_SERVICE_NAME_MAX_LENGTH:70} instanceNameMaxLength: ${SW_INSTANCE_NAME_MAX_LENGTH:70} # The max length of service + endpoint names should be less than 240 endpointNameMaxLength: ${SW_ENDPOINT_NAME_MAX_LENGTH:150} # Define the set of span tag keys, which should be searchable through the GraphQL. searchableTracesTags: ${SW_SEARCHABLE_TAG_KEYS:http.method,status_code,db.type,db.instance,mq.queue,mq.topic,mq.broker}storage: selector: ${SW_STORAGE:h2} elasticsearch: nameSpace: ${SW_NAMESPACE:""} clusterNodes: ${SW_STORAGE_ES_CLUSTER_NODES:localhost:9200} protocol: ${SW_STORAGE_ES_HTTP_PROTOCOL:"http"} user: ${SW_ES_USER:""} password: ${SW_ES_PASSWORD:""} trustStorePath: ${SW_STORAGE_ES_SSL_JKS_PATH:""} trustStorePass: ${SW_STORAGE_ES_SSL_JKS_PASS:""} secretsManagementFile: ${SW_ES_SECRETS_MANAGEMENT_FILE:""} # Secrets management file in the properties format includes the username, password, which are managed by 3rd party tool. dayStep: ${SW_STORAGE_DAY_STEP:1} # Represent the number of days in the one minute/hour/day index. indexShardsNumber: ${SW_STORAGE_ES_INDEX_SHARDS_NUMBER:1} # Shard number of new indexes indexReplicasNumber: ${SW_STORAGE_ES_INDEX_REPLICAS_NUMBER:1} # Replicas number of new indexes # Super data set has been defined in the codes, such as trace segments.The following 3 config would be improve es performance when storage super size data in es. superDatasetDayStep: ${SW_SUPERDATASET_STORAGE_DAY_STEP:-1} # Represent the number of days in the super size dataset record index, the default value is the same as dayStep when the value is less than 0 superDatasetIndexShardsFactor: ${SW_STORAGE_ES_SUPER_DATASET_INDEX_SHARDS_FACTOR:5} # This factor provides more shards for the super data set, shards number = indexShardsNumber * superDatasetIndexShardsFactor. Also, this factor effects Zipkin and Jaeger traces. superDatasetIndexReplicasNumber: ${SW_STORAGE_ES_SUPER_DATASET_INDEX_REPLICAS_NUMBER:0} # Represent the replicas number in the super size dataset record index, the default value is 0. bulkActions: ${SW_STORAGE_ES_BULK_ACTIONS:1000} # Execute the async bulk record data every ${SW_STORAGE_ES_BULK_ACTIONS} requests syncBulkActions: ${SW_STORAGE_ES_SYNC_BULK_ACTIONS:50000} # Execute the sync bulk metrics data every ${SW_STORAGE_ES_SYNC_BULK_ACTIONS} requests flushInterval: ${SW_STORAGE_ES_FLUSH_INTERVAL:10} # flush the bulk every 10 seconds whatever the number of requests concurrentRequests: ${SW_STORAGE_ES_CONCURRENT_REQUESTS:2} # the number of concurrent requests resultWindowMaxSize: ${SW_STORAGE_ES_QUERY_MAX_WINDOW_SIZE:10000} metadataQueryMaxSize: ${SW_STORAGE_ES_QUERY_MAX_SIZE:5000} segmentQueryMaxSize: ${SW_STORAGE_ES_QUERY_SEGMENT_SIZE:200} profileTaskQueryMaxSize: ${SW_STORAGE_ES_QUERY_PROFILE_TASK_SIZE:200} advanced: ${SW_STORAGE_ES_ADVANCED:""} elasticsearch7: nameSpace: ${SW_NAMESPACE:""} clusterNodes: ${SW_STORAGE_ES_CLUSTER_NODES:localhost:9200} protocol: ${SW_STORAGE_ES_HTTP_PROTOCOL:"http"} trustStorePath: ${SW_STORAGE_ES_SSL_JKS_PATH:""} trustStorePass: ${SW_STORAGE_ES_SSL_JKS_PASS:""} dayStep: ${SW_STORAGE_DAY_STEP:1} # Represent the number of days in the one minute/hour/day index. indexShardsNumber: ${SW_STORAGE_ES_INDEX_SHARDS_NUMBER:1} # Shard number of new indexes indexReplicasNumber: ${SW_STORAGE_ES_INDEX_REPLICAS_NUMBER:1} # Replicas number of new indexes # Super data set has been defined in the codes, such as trace segments.The following 3 config would be improve es performance when storage super size data in es. superDatasetDayStep: ${SW_SUPERDATASET_STORAGE_DAY_STEP:-1} # Represent the number of days in the super size dataset record index, the default value is the same as dayStep when the value is less than 0 superDatasetIndexShardsFactor: ${SW_STORAGE_ES_SUPER_DATASET_INDEX_SHARDS_FACTOR:5} # This factor provides more shards for the super data set, shards number = indexShardsNumber * superDatasetIndexShardsFactor. Also, this factor effects Zipkin and Jaeger traces. superDatasetIndexReplicasNumber: ${SW_STORAGE_ES_SUPER_DATASET_INDEX_REPLICAS_NUMBER:0} # Represent the replicas number in the super size dataset record index, the default value is 0. user: ${SW_ES_USER:""} password: ${SW_ES_PASSWORD:""} secretsManagementFile: ${SW_ES_SECRETS_MANAGEMENT_FILE:""} # Secrets management file in the properties format includes the username, password, which are managed by 3rd party tool. bulkActions: ${SW_STORAGE_ES_BULK_ACTIONS:1000} # Execute the async bulk record data every ${SW_STORAGE_ES_BULK_ACTIONS} requests syncBulkActions: ${SW_STORAGE_ES_SYNC_BULK_ACTIONS:50000} # Execute the sync bulk metrics data every ${SW_STORAGE_ES_SYNC_BULK_ACTIONS} requests flushInterval: ${SW_STORAGE_ES_FLUSH_INTERVAL:10} # flush the bulk every 10 seconds whatever the number of requests concurrentRequests: ${SW_STORAGE_ES_CONCURRENT_REQUESTS:2} # the number of concurrent requests resultWindowMaxSize: ${SW_STORAGE_ES_QUERY_MAX_WINDOW_SIZE:10000} metadataQueryMaxSize: ${SW_STORAGE_ES_QUERY_MAX_SIZE:5000} segmentQueryMaxSize: ${SW_STORAGE_ES_QUERY_SEGMENT_SIZE:200} profileTaskQueryMaxSize: ${SW_STORAGE_ES_QUERY_PROFILE_TASK_SIZE:200} advanced: ${SW_STORAGE_ES_ADVANCED:""} h2: driver: ${SW_STORAGE_H2_DRIVER:org.h2.jdbcx.JdbcDataSource} url: ${SW_STORAGE_H2_URL:jdbc:h2:mem:skywalking-oap-db} user: ${SW_STORAGE_H2_USER:sa} metadataQueryMaxSize: ${SW_STORAGE_H2_QUERY_MAX_SIZE:5000} maxSizeOfArrayColumn: ${SW_STORAGE_MAX_SIZE_OF_ARRAY_COLUMN:20} numOfSearchableValuesPerTag: ${SW_STORAGE_NUM_OF_SEARCHABLE_VALUES_PER_TAG:2} mysql: properties: jdbcUrl: ${SW_JDBC_URL:"jdbc:mysql://localhost:3306/swtest"} dataSource.user: ${SW_DATA_SOURCE_USER:root} dataSource.password: ${SW_DATA_SOURCE_PASSWORD:root@1234} dataSource.cachePrepStmts: ${SW_DATA_SOURCE_CACHE_PREP_STMTS:true} dataSource.prepStmtCacheSize: ${SW_DATA_SOURCE_PREP_STMT_CACHE_SQL_SIZE:250} dataSource.prepStmtCacheSqlLimit: ${SW_DATA_SOURCE_PREP_STMT_CACHE_SQL_LIMIT:2048} dataSource.useServerPrepStmts: ${SW_DATA_SOURCE_USE_SERVER_PREP_STMTS:true} metadataQueryMaxSize: ${SW_STORAGE_MYSQL_QUERY_MAX_SIZE:5000} maxSizeOfArrayColumn: ${SW_STORAGE_MAX_SIZE_OF_ARRAY_COLUMN:20} numOfSearchableValuesPerTag: ${SW_STORAGE_NUM_OF_SEARCHABLE_VALUES_PER_TAG:2} tidb: properties: jdbcUrl: ${SW_JDBC_URL:"jdbc:mysql://localhost:4000/tidbswtest"} dataSource.user: ${SW_DATA_SOURCE_USER:root} dataSource.password: ${SW_DATA_SOURCE_PASSWORD:""} dataSource.cachePrepStmts: ${SW_DATA_SOURCE_CACHE_PREP_STMTS:true} dataSource.prepStmtCacheSize: ${SW_DATA_SOURCE_PREP_STMT_CACHE_SQL_SIZE:250} dataSource.prepStmtCacheSqlLimit: ${SW_DATA_SOURCE_PREP_STMT_CACHE_SQL_LIMIT:2048} dataSource.useServerPrepStmts: ${SW_DATA_SOURCE_USE_SERVER_PREP_STMTS:true} dataSource.useAffectedRows: ${SW_DATA_SOURCE_USE_AFFECTED_ROWS:true} metadataQueryMaxSize: ${SW_STORAGE_MYSQL_QUERY_MAX_SIZE:5000} maxSizeOfArrayColumn: ${SW_STORAGE_MAX_SIZE_OF_ARRAY_COLUMN:20} numOfSearchableValuesPerTag: ${SW_STORAGE_NUM_OF_SEARCHABLE_VALUES_PER_TAG:2} influxdb: # InfluxDB configuration url: ${SW_STORAGE_INFLUXDB_URL user: ${SW_STORAGE_INFLUXDB_USER:root} password: ${SW_STORAGE_INFLUXDB_PASSWORD:} database: ${SW_STORAGE_INFLUXDB_DATABASE:skywalking} actions: ${SW_STORAGE_INFLUXDB_ACTIONS:1000} # the number of actions to collect duration: ${SW_STORAGE_INFLUXDB_DURATION:1000} # the time to wait at most (milliseconds) batchEnabled: ${SW_STORAGE_INFLUXDB_BATCH_ENABLED:true} fetchTaskLogMaxSize: ${SW_STORAGE_INFLUXDB_FETCH_TASK_LOG_MAX_SIZE:5000} # the max number of fetch task log in a requestagent-analyzer: selector: ${SW_AGENT_ANALYZER:default} default: sampleRate: ${SW_TRACE_SAMPLE_RATE:10000} # The sample rate precision is 1/10000. 10000 means 100% sample in default. slowDBAccessThreshold: ${SW_SLOW_DB_THRESHOLD:default:200,mongodb:100} # The slow database access thresholds. Unit ms. forceSampleErrorSegment: ${SW_FORCE_SAMPLE_ERROR_SEGMENT:true} # When sampling mechanism active, this config can open(true) force save some error segment. true is default. segmentStatusAnalysisStrategy: ${SW_SEGMENT_STATUS_ANALYSIS_STRATEGY:FROM_SPAN_STATUS} # Determine the final segment status from the status of spans. Available values are `FROM_SPAN_STATUS` , `FROM_ENTRY_SPAN` and `FROM_FIRST_SPAN`. `FROM_SPAN_STATUS` represents the segment status would be error if any span is in error status. `FROM_ENTRY_SPAN` means the segment status would be determined by the status of entry spans only. `FROM_FIRST_SPAN` means the segment status would be determined by the status of the first span only. # Nginx and Envoy agents can't get the real remote address. # Exit spans with the component in the list would not generate the client-side instance relation metrics. noUpstreamRealAddressAgents: ${SW_NO_UPSTREAM_REAL_ADDRESS:6000,9000} slowTraceSegmentThreshold: ${SW_SLOW_TRACE_SEGMENT_THRESHOLD:-1} # Setting this threshold about the latency would make the slow trace segments sampled if they cost more time, even the sampling mechanism activated. The default value is `-1`, which means would not sample slow traces. Unit, millisecond. meterAnalyzerActiveFiles: ${SW_METER_ANALYZER_ACTIVE_FILES:} # Which files could be meter analyzed, files split by ","receiver-sharing-server: selector: ${SW_RECEIVER_SHARING_SERVER:default} default: # For Jetty server restHost: ${SW_RECEIVER_SHARING_REST_HOST:0.0.0.0} restPort: ${SW_RECEIVER_SHARING_REST_PORT:0} contextPath: ${SW_RECEIVER_SHARING_REST_CONTEXT_PATH:/} restMinThreads: ${SW_RECEIVER_SHARING_JETTY_MIN_THREADS:1} restMaxThreads: ${SW_RECEIVER_SHARING_JETTY_MAX_THREADS:200} restIdleTimeOut: ${SW_RECEIVER_SHARING_JETTY_IDLE_TIMEOUT:30000} restAcceptorPriorityDelta: ${SW_RECEIVER_SHARING_JETTY_DELTA:0} restAcceptQueueSize: ${SW_RECEIVER_SHARING_JETTY_QUEUE_SIZE:0} # For gRPC server gRPCHost: ${SW_RECEIVER_GRPC_HOST:0.0.0.0} gRPCPort: ${SW_RECEIVER_GRPC_PORT:0} maxConcurrentCallsPerConnection: ${SW_RECEIVER_GRPC_MAX_CONCURRENT_CALL:0} maxMessageSize: ${SW_RECEIVER_GRPC_MAX_MESSAGE_SIZE:0} gRPCThreadPoolQueueSize: ${SW_RECEIVER_GRPC_POOL_QUEUE_SIZE:0} gRPCThreadPoolSize: ${SW_RECEIVER_GRPC_THREAD_POOL_SIZE:0} gRPCSslEnabled: ${SW_RECEIVER_GRPC_SSL_ENABLED:false} gRPCSslKeyPath: ${SW_RECEIVER_GRPC_SSL_KEY_PATH:""} gRPCSslCertChainPath: ${SW_RECEIVER_GRPC_SSL_CERT_CHAIN_PATH:""} authentication: ${SW_AUTHENTICATION:""}receiver-register: selector: ${SW_RECEIVER_REGISTER:default} default:receiver-trace: selector: ${SW_RECEIVER_TRACE:default} default:receiver-jvm: selector: ${SW_RECEIVER_JVM:default} default:receiver-clr: selector: ${SW_RECEIVER_CLR:default} default:receiver-profile: selector: ${SW_RECEIVER_PROFILE:default} default:service-mesh: selector: ${SW_SERVICE_MESH:default} default:envoy-metric: selector: ${SW_ENVOY_METRIC:default} default: acceptMetricsService: ${SW_ENVOY_METRIC_SERVICE:true} alsHTTPAnalysis: ${SW_ENVOY_METRIC_ALS_HTTP_ANALYSIS:""} # `k8sServiceNameRule` allows you to customize the service name in ALS via Kubernetes metadata, # the available variables are `pod`, `service`, f.e., you can use `${service.metadata.name}-${pod.metadata.labels.version}` # to append the version number to the service name. # Be careful, when using environment variables to pass this configuration, use single quotes(`''`) to avoid it being evaluated by the shell. k8sServiceNameRule: ${K8S_SERVICE_NAME_RULE:"${service.metadata.name}"}prometheus-fetcher: selector: ${SW_PROMETHEUS_FETCHER:-} default: enabledRules: ${SW_PROMETHEUS_FETCHER_ENABLED_RULES:"self"}kafka-fetcher: selector: ${SW_KAFKA_FETCHER:-} default: bootstrapServers: ${SW_KAFKA_FETCHER_SERVERS:localhost:9092} partitions: ${SW_KAFKA_FETCHER_PARTITIONS:3} replicationFactor: ${SW_KAFKA_FETCHER_PARTITIONS_FACTOR:2} enableMeterSystem: ${SW_KAFKA_FETCHER_ENABLE_METER_SYSTEM:false} isSharding: ${SW_KAFKA_FETCHER_IS_SHARDING:false} consumePartitions: ${SW_KAFKA_FETCHER_CONSUME_PARTITIONS:""} kafkaHandlerThreadPoolSize: ${SW_KAFKA_HANDLER_THREAD_POOL_SIZE:-1} kafkaHandlerThreadPoolQueueSize: ${SW_KAFKA_HANDLER_THREAD_POOL_QUEUE_SIZE:-1}receiver-meter: selector: ${SW_RECEIVER_METER:default} default:receiver-otel: selector: ${SW_OTEL_RECEIVER:-} default: enabledHandlers: ${SW_OTEL_RECEIVER_ENABLED_HANDLERS:"oc"} enabledOcRules: ${SW_OTEL_RECEIVER_ENABLED_OC_RULES:"istio-controlplane"}receiver_zipkin: selector: ${SW_RECEIVER_ZIPKIN:-} default: host: ${SW_RECEIVER_ZIPKIN_HOST:0.0.0.0} port: ${SW_RECEIVER_ZIPKIN_PORT:9411} contextPath: ${SW_RECEIVER_ZIPKIN_CONTEXT_PATH:/} jettyMinThreads: ${SW_RECEIVER_ZIPKIN_JETTY_MIN_THREADS:1} jettyMaxThreads: ${SW_RECEIVER_ZIPKIN_JETTY_MAX_THREADS:200} jettyIdleTimeOut: ${SW_RECEIVER_ZIPKIN_JETTY_IDLE_TIMEOUT:30000} jettyAcceptorPriorityDelta: ${SW_RECEIVER_ZIPKIN_JETTY_DELTA:0} jettyAcceptQueueSize: ${SW_RECEIVER_ZIPKIN_QUEUE_SIZE:0}receiver_jaeger: selector: ${SW_RECEIVER_JAEGER:-} default: gRPCHost: ${SW_RECEIVER_JAEGER_HOST:0.0.0.0} gRPCPort: ${SW_RECEIVER_JAEGER_PORT:14250}receiver-browser: selector: ${SW_RECEIVER_BROWSER:default} default: # The sample rate precision is 1/10000. 10000 means 100% sample in default. sampleRate: ${SW_RECEIVER_BROWSER_SAMPLE_RATE:10000}query: selector: ${SW_QUERY:graphql} graphql: path: ${SW_QUERY_GRAPHQL_PATH:/graphql}alarm: selector: ${SW_ALARM:default} default:telemetry: selector: ${SW_TELEMETRY:none} none: prometheus: host: ${SW_TELEMETRY_PROMETHEUS_HOST:0.0.0.0} port: ${SW_TELEMETRY_PROMETHEUS_PORT:1234} sslEnabled: ${SW_TELEMETRY_PROMETHEUS_SSL_ENABLED:false} sslKeyPath: ${SW_TELEMETRY_PROMETHEUS_SSL_KEY_PATH:""} sslCertChainPath: ${SW_TELEMETRY_PROMETHEUS_SSL_CERT_CHAIN_PATH:""}configuration: selector: ${SW_CONFIGURATION:none} none: grpc: host: ${SW_DCS_SERVER_HOST:""} port: ${SW_DCS_SERVER_PORT:80} clusterName: ${SW_DCS_CLUSTER_NAME:SkyWalking} period: ${SW_DCS_PERIOD:20} apollo: apolloMeta: ${SW_CONFIG_APOLLO apolloCluster: ${SW_CONFIG_APOLLO_CLUSTER:default} apolloEnv: ${SW_CONFIG_APOLLO_ENV:""} appId: ${SW_CONFIG_APOLLO_APP_ID:skywalking} period: ${SW_CONFIG_APOLLO_PERIOD:5} zookeeper: period: ${SW_CONFIG_ZK_PERIOD:60} # Unit seconds, sync period. Default fetch every 60 seconds. nameSpace: ${SW_CONFIG_ZK_NAMESPACE:/default} hostPort: ${SW_CONFIG_ZK_HOST_PORT:localhost:2181} # Retry Policy baseSleepTimeMs: ${SW_CONFIG_ZK_BASE_SLEEP_TIME_MS:1000} # initial amount of time to wait between retries maxRetries: ${SW_CONFIG_ZK_MAX_RETRIES:3} # max number of times to retry etcd: period: ${SW_CONFIG_ETCD_PERIOD:60} # Unit seconds, sync period. Default fetch every 60 seconds. group: ${SW_CONFIG_ETCD_GROUP:skywalking} serverAddr: ${SW_CONFIG_ETCD_SERVER_ADDR:localhost:2379} clusterName: ${SW_CONFIG_ETCD_CLUSTER_NAME:default} consul: # Consul host and ports, separated by comma, e.g. 1.2.3.4:8500,2.3.4.5:8500 hostAndPorts: ${SW_CONFIG_CONSUL_HOST_AND_PORTS:1.2.3.4:8500} # Sync period in seconds. Defaults to 60 seconds. period: ${SW_CONFIG_CONSUL_PERIOD:60} # Consul aclToken aclToken: ${SW_CONFIG_CONSUL_ACL_TOKEN:""} k8s-configmap: period: ${SW_CONFIG_CONFIGMAP_PERIOD:60} namespace: ${SW_CLUSTER_K8S_NAMESPACE:default} labelSelector: ${SW_CLUSTER_K8S_LABEL:app=collector,release=skywalking} nacos: # Nacos Server Host serverAddr: ${SW_CONFIG_NACOS_SERVER_ADDR:127.0.0.1} # Nacos Server Port port: ${SW_CONFIG_NACOS_SERVER_PORT:8848} # Nacos Configuration Group group: ${SW_CONFIG_NACOS_SERVER_GROUP:skywalking} # Nacos Configuration namespace namespace: ${SW_CONFIG_NACOS_SERVER_NAMESPACE:} # Unit seconds, sync period. Default fetch every 60 seconds. period: ${SW_CONFIG_NACOS_PERIOD:60} # Nacos auth username username: ${SW_CONFIG_NACOS_USERNAME:""} password: ${SW_CONFIG_NACOS_PASSWORD:""} # Nacos auth accessKey accessKey: ${SW_CONFIG_NACOS_ACCESSKEY:""} secretKey: ${SW_CONFIG_NACOS_SECRETKEY:""}exporter: selector: ${SW_EXPORTER:-} grpc: targetHost: ${SW_EXPORTER_GRPC_HOST:127.0.0.1} targetPort: ${SW_EXPORTER_GRPC_PORT:9870}health-checker: selector: ${SW_HEALTH_CHECKER:-} default: checkIntervalSeconds: ${SW_HEALTH_CHECKER_INTERVAL_SECONDS:5}View Code
2.4 创建&启动UI
docker run -d --name skywalking-ui \--restart=always \-e TZ=Asia/Shanghai \-p 8101:8080 \--link oap:oap \-e SW_OAP_ADDRESS=oap:12800 \apache/skywalking-ui:8.3.0
2.5 下载源码包
wget https://mirrors.tuna.tsinghua.edu.cn/apache/skywalking/8.3.0/apache-skywalking-apm-8.3.0.tar.gz
官网的源码包下载比较慢,就换成tuna的了。下载好了之后,解压在/opt目录下,暂时不用管,这个在后面会用到agent。
v部署/接入SkyWalking
3.1 生成springboot JAR包
若生成springbootJAR包有疑惑的,可以看看这篇文章。SpringBoot入门教程(二)CentOS部署SpringBoot项目从0到1
3.2 启动JAR包
nohup java -javaagent:/opt/apache-skywalking-apm-bin/agent/skywalking-agent.jar -Dskywalking.agent.service_name=toutou_blog -Dskywalking.collector.backend_service=127.0.0.1:11800 -jar /data/package/learn-web-0.0.1-SNAPSHOT.jar -d --server.port=8100 &
-javaagent:用于指定探针路径。指定agent包位置。在上面的步骤中已经将apache-skywalking-apm-8.3.0.tar.gz解压到/opt目录了,因此路径为:/opt/apache-skywalking-apm-bin/agent/skywalking-agent.jar
-Dskywalking.agent.service_name:用于重写 agent/config/agent.config 配置文件中的服务名
-Dskywalking.collector.backend_service:用于重写agent/config/agent.config 配置文件中的服务地址
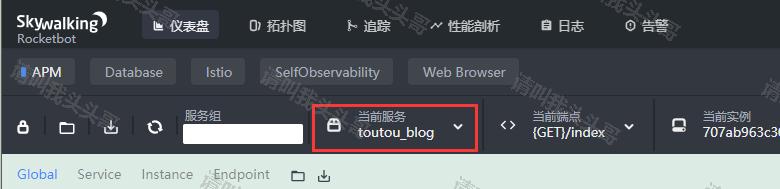
3.3 访问UI
第一次访问时,需要先调用springboot中的接口后,SkyWalking UI中即会load对应的信息,效果如下图。
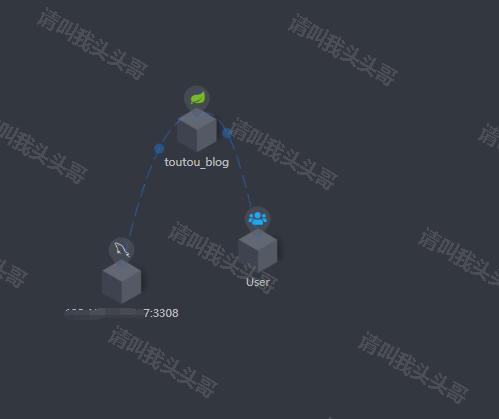
拓扑图/topology:
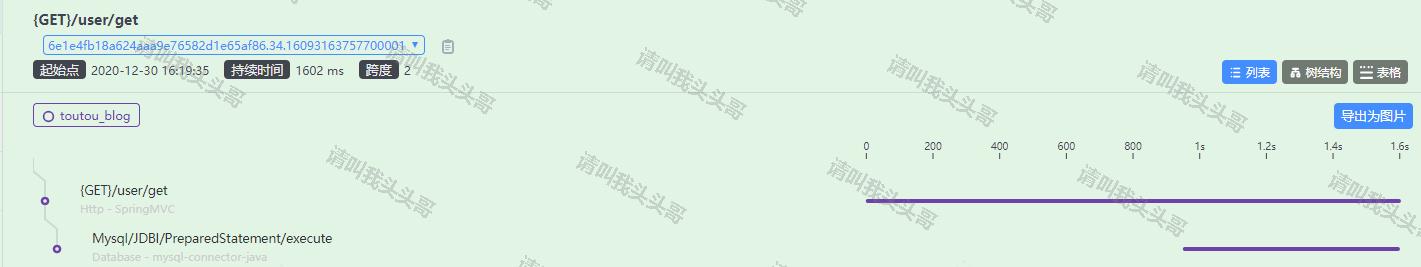
追踪/trace:
关于更多SkyWalking UI介绍,可以看看官方介绍。
其他参考/学习资料:
- Apache SkyWalking 官方文档
- SkyWalking中文博客
- SkyWalking 文档中文版(社区提供)
v源码地址
https://github.com/toutouge/javademosecond/tree/master/hellolearn
作 者:请叫我头头哥
出 处
关于作者:专注于基础平台的项目开发。如有问题或建议,请多多赐教!
版权声明:本文版权归作者和博客园共有,欢迎转载,但未经作者同意必须保留此段声明,且在文章页面明显位置给出原文链接。
特此声明:所有评论和私信都会在第一时间回复。也欢迎园子的大大们指正错误,共同进步。或者直接私信我
声援博主:如果您觉得文章对您有帮助,可以点击文章右下角【推荐】一下。您的鼓励是作者坚持原创和持续写作的最大动力!
原文转载:http://www.shaoqun.com/a/552573.html
damai:https://www.ikjzd.com/w/1391
斑马物联网:https://www.ikjzd.com/w/1316
流行的APM(ApplicationPerformanceManagement工具有很多,比如Cat、Zipkin、Pinpoint、SkyWalking,优秀的监控工具还有很多,其它比如还有zabbix、prometheus、Arthas、Grafana之类的。这里主要介绍SkyWalking,它是一款优秀的国产APM工具,包括了分布式追踪、性能指标分析、应用和服务依赖分析等。Skywalkin
ishare:ishare
邮乐购物商城:邮乐购物商城
做亚马逊如何提升产品利润?:做亚马逊如何提升产品利润?
这么多卖家不知道去哪找货源?这些优质渠道都可以!:这么多卖家不知道去哪找货源?这些优质渠道都可以!
亚马逊Lisiting重大更新-QA可以插入视频:亚马逊Lisiting重大更新-QA可以插入视频
没有评论:
发表评论